

What Is the BTC Dominance Index and How Can You Trade It?
Introduction to the Bitcoin Dominance Index (BTC.D)

1. What Is BTC Dominance (BTC.D)?
Picture the entire crypto market as a pie. Every coin, token, and digital asset takes a slice. BTC Dominance (BTC.D) measures how large Bitcoin’s slice is relative to the whole pie.
The math is straightforward: take Bitcoin’s market cap, divide it by the combined market cap of the top 125 crypto assets, and express it as a percentage.
BTC Dominance = (Bitcoin Market Cap ÷ Top 125 Crypto Assets Market Cap)
Think of it this way: if the entire crypto market is worth $3 trillion and Bitcoin accounts for $1.8 trillion of that, BTC.D is 60%.
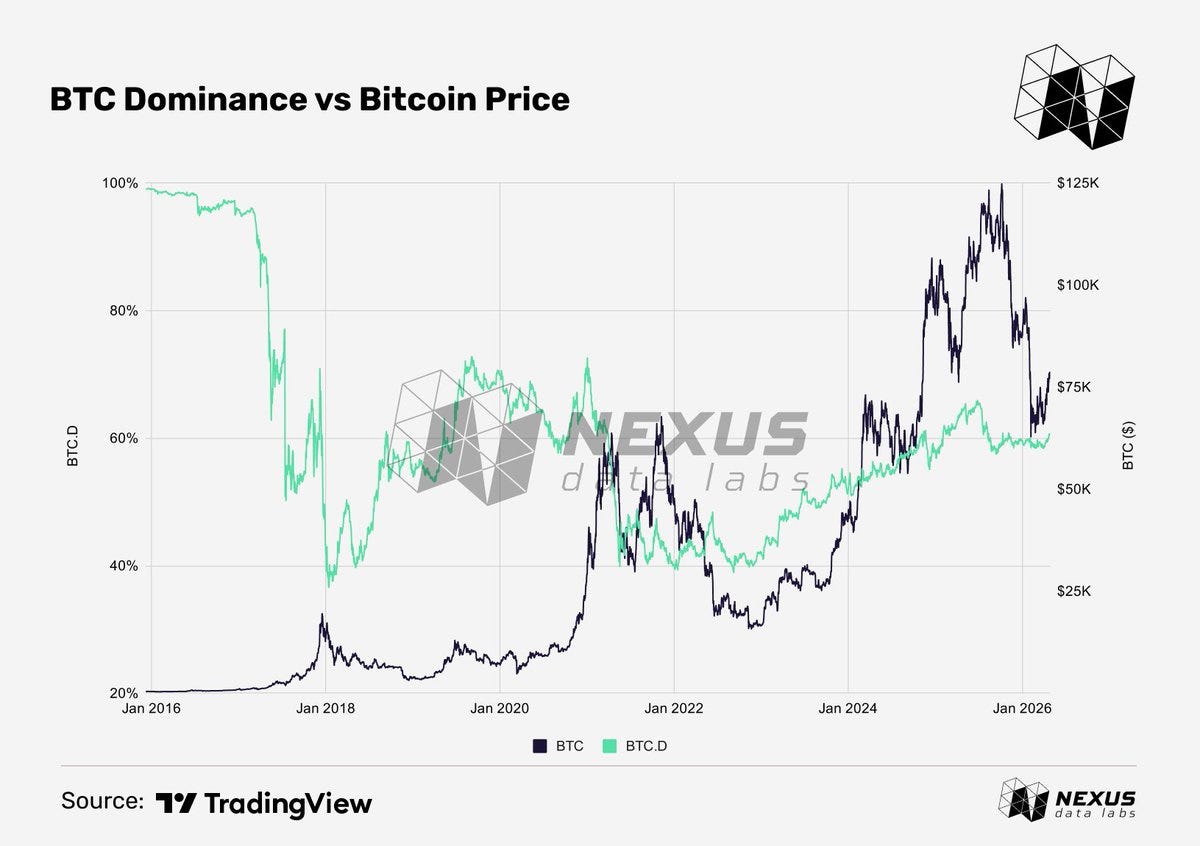
In simple terms, BTC.D tells you where capital is concentrated. When BTC.D is high, above 60%, most of the money in crypto is sitting in Bitcoin. When it drops toward 40% or lower, that capital is spreading into altcoins. BTC.D does not tell you whether Bitcoin’s price is going up or down. It tells you where investors are choosing to allocate their money in the crypto market.
While the formula is simple, it reveals far more than the math suggests. BTC.D acts as a real-time indicator of market sentiment, showing whether the market is consolidating around Bitcoin or expanding into riskier assets.
2. Why Does BTC Dominance Move?
BTC.D shifts when the balance between Bitcoin and the rest of the market changes.
Market sentiment and risk appetite. When traders are willing to take on risk, capital rotates out of Bitcoin into smaller, more volatile assets in search of higher returns. This pushes BTC.D lower. When fear takes over, the opposite happens. Capital consolidates back into Bitcoin.
Altcoin innovation cycles. New narratives consistently pull capital away from Bitcoin. DeFi Summer in 2020, NFTs in 2021, and AI tokens in 2024 each triggered sharp drops in dominance as money rotated into the latest theme. Bitcoin did not necessarily fall in price; it simply grew more slowly than the rest of the market.
Institutional adoption. Large institutions mostly buy Bitcoin, not altcoins. The approval of spot Bitcoin ETFs in January 2024 marked a structural shift. Billions flowed into BTC through regulated products, pushing BTC.D from 52% in early 2024 to over 58% within a year, as institutional inflows concentrated specifically in Bitcoin rather than spreading across the market.
Stablecoin distortion. Stablecoins like USDT and USDC are included in the total market cap calculation. With stablecoins now accounting for over $300B of the total crypto market, their growth can push BTC.D lower even when nothing has actually changed in how investors feel about Bitcoin versus altcoins. This is worth keeping in mind when dominance moves without an obvious reason.
3. BTC Dominance Across Market Cycles
BTC.D follows recognizable patterns across bull and bear markets. Here is what history shows:
2017 ICO boom. BTC.D collapsed from ~95% to ~39% as thousands of new tokens launched and absorbed capital. Bitcoin was hitting all-time highs in dollar terms, but everything else was growing faster.
2018 bear market. When the bubble burst, altcoins fell harder than Bitcoin. Investors retreated to BTC as the least-bad option, and dominance climbed back toward 70% by late 2019.
2020 DeFi and NFT bull market. BTC.D dropped from ~70% in January 2021 to ~40% by May 2021 as DeFi protocols, NFTs, and alternative Layer 1 blockchains pulled massive capital away from Bitcoin.
2022 LUNA and FTX collapses. Two of the biggest failures in crypto history triggered panic across the market. Even as everything fell, Bitcoin fell less. BTC.D climbed from ~40% to ~47% as traders parked in Bitcoin relative to everything else.
2024 institutional era. ETF inflows and corporate Bitcoin treasury purchases pushed BTC.D back above 65%. Unlike previous cycles, dominance rose during a bull market, driven by institutional money that specifically favored Bitcoin.
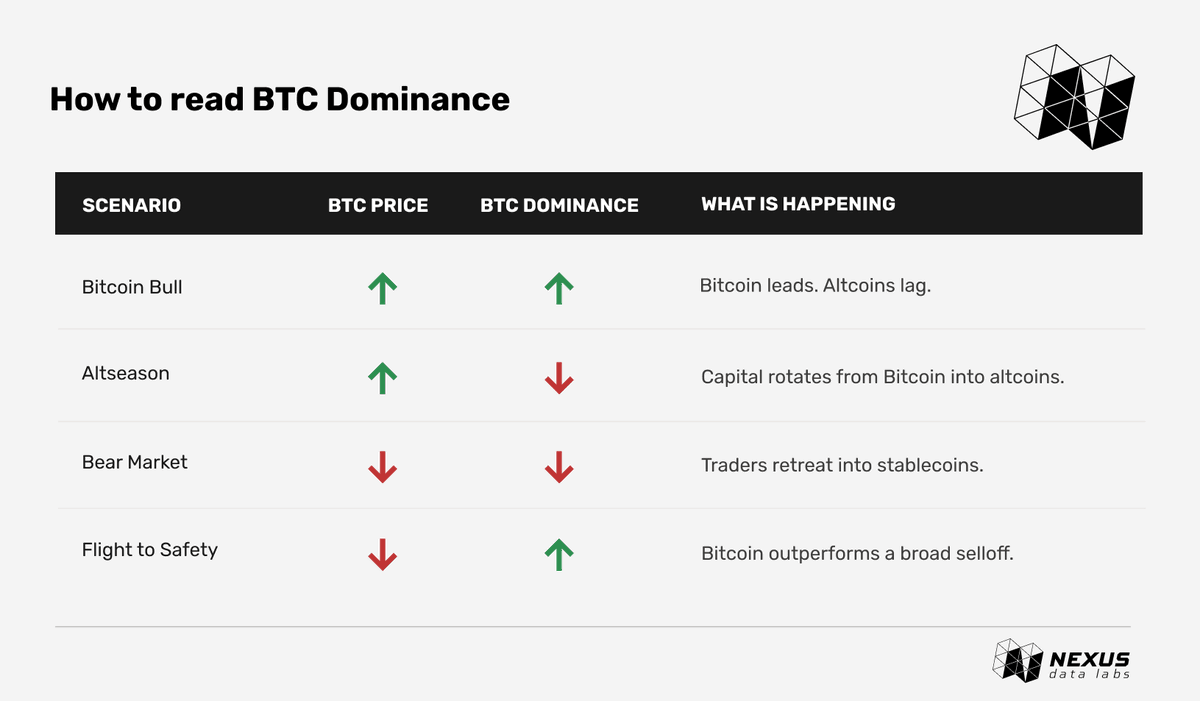
4. How to Read BTC Dominance
BTC.D is most useful when read alongside Bitcoin’s price. Together, the two tell you how capital is actually moving across the market:
5. Trading BTC Dominance
BTC.D can be traded as a direct expression of where the market is headed. The setups below are strategies traders have historically used to position around dominance shifts. They are included here for educational purposes only. None of this is financial advice. Always do your own research before making any trading decisions.
Altseason Signal (BTC.D below 54%)
When BTC.D closes below 54% on the weekly chart, it has historically signaled that capital is starting to rotate into altcoins.
How traders approach it: wait for a confirmed weekly close below 54%, then short BTC.D, betting that dominance will continue to fall as altcoins pick up momentum.
BTC Strength Signal (BTC.D above 60%)
When BTC.D pushes above 60%, it has historically meant Bitcoin is outperforming the broader market. Institutional buyers tend to favor BTC at these levels, and the trend can persist.
How traders approach it: wait for a confirmed weekly close above 60%, then go long BTC.D, betting that Bitcoin continues to outperform.
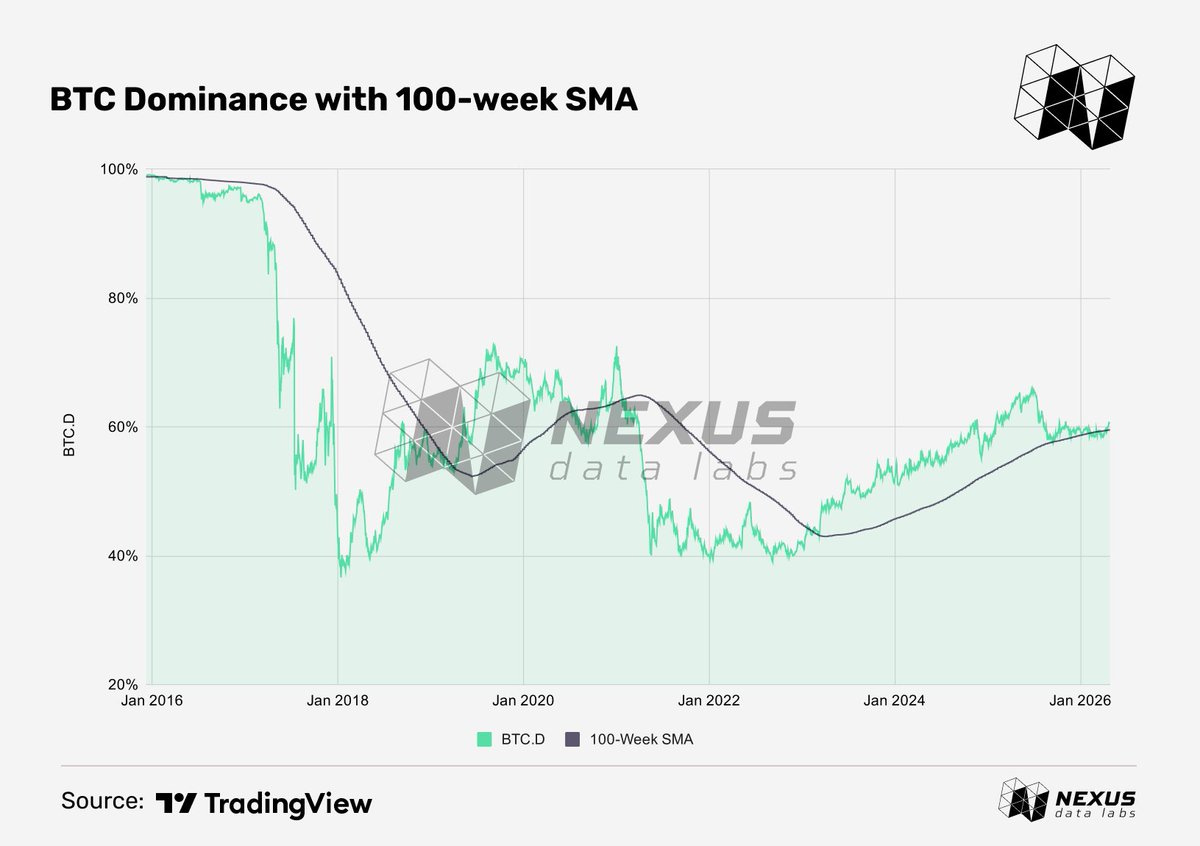
100-Week Moving Average Rejection
The 100-week moving average represents the average of BTC.D’s weekly closes over the past two years. Think of it as the market’s baseline for normal dominance.
When BTC.D rallies back to that level from below and fails to break through, traders interpret it as a sign that the move is losing strength, and dominance is likely to fall again.
How traders approach it: monitor the 100-week SMA on the BTC.D chart, wait for BTC.D to tag the line and fail to break above it, then short BTC.D, expecting a move lower.
6. Trading BTC Dominance Onchain
Historically, taking a position on BTC Dominance required managing multiple trades at once. Traders would long Bitcoin and short a basket of altcoins, then constantly rebalance as prices moved. It was messy and expensive, and introduced execution complexity and rebalancing risk that made the final position a rough approximation of the original thesis at best.
Paragon (@tradeparagon) was built to solve that. It offers a BTC Dominance perpetual contract on Hyperliquid, giving traders direct exposure to BTC.D in a single position.
Beyond BTC.D, Paragon offers two additional index perpetuals: OTHERS, tracking the total crypto market cap excluding the top 10 assets, and TOTAL2, covering the broader altcoin market excluding Bitcoin. Together, the three products give traders a toolkit for expressing macro views on crypto market structure, whether that is hedging an altcoin portfolio, positioning for rotation, or trading dominance as its own market.
Learn more at Paragon.
Disclaimer
This article was produced in partnership with Paragon. The content is for informational and educational purposes only and does not constitute financial, investment, or trading advice. Nothing in this article should be relied on as a recommendation to buy, sell, or hold any digital asset. Do your own research before making any trading decisions.