

What Is the OTHERS Index and How Can You Trade It?
Introduction to the OTHERS index

1. What Is the OTHERS Index?
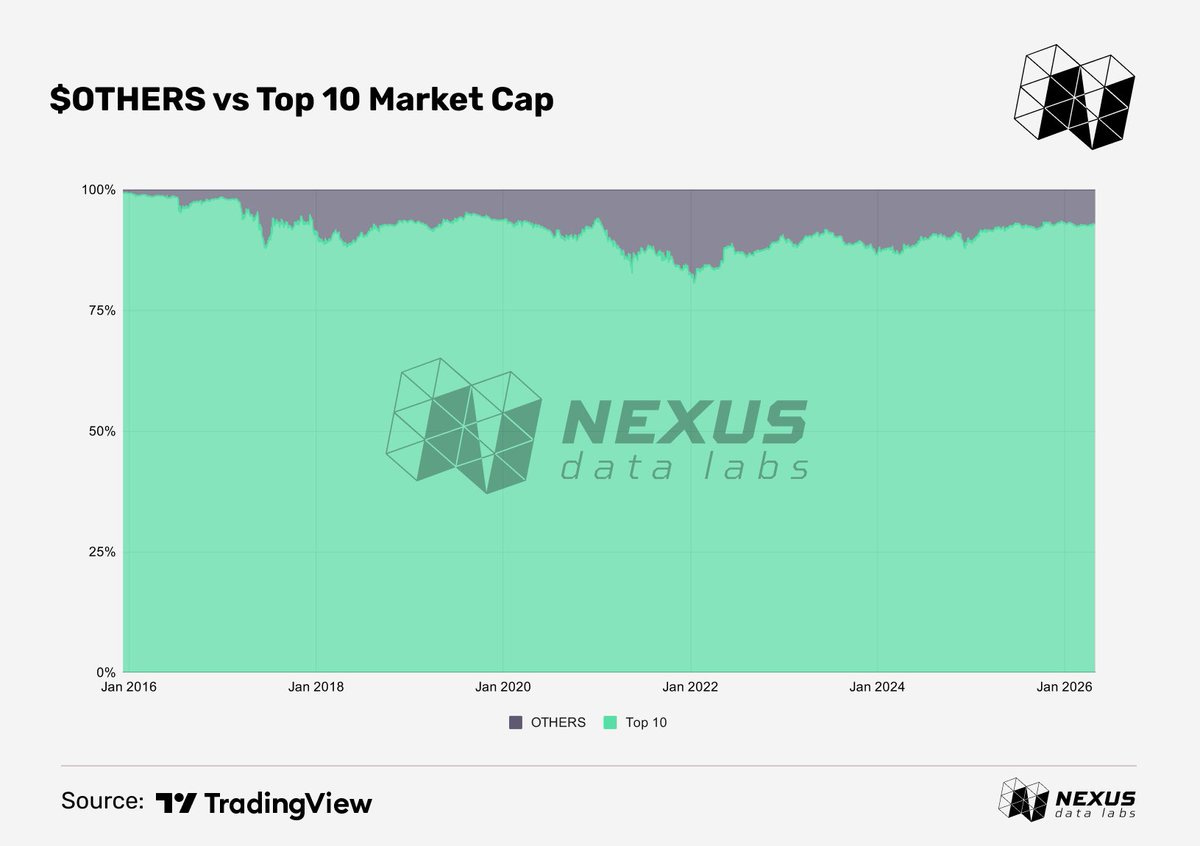
The top 10 crypto assets tend to dominate major headlines and drive most of the market cap. But the long tail of mid and small caps beyond them tells a different story.
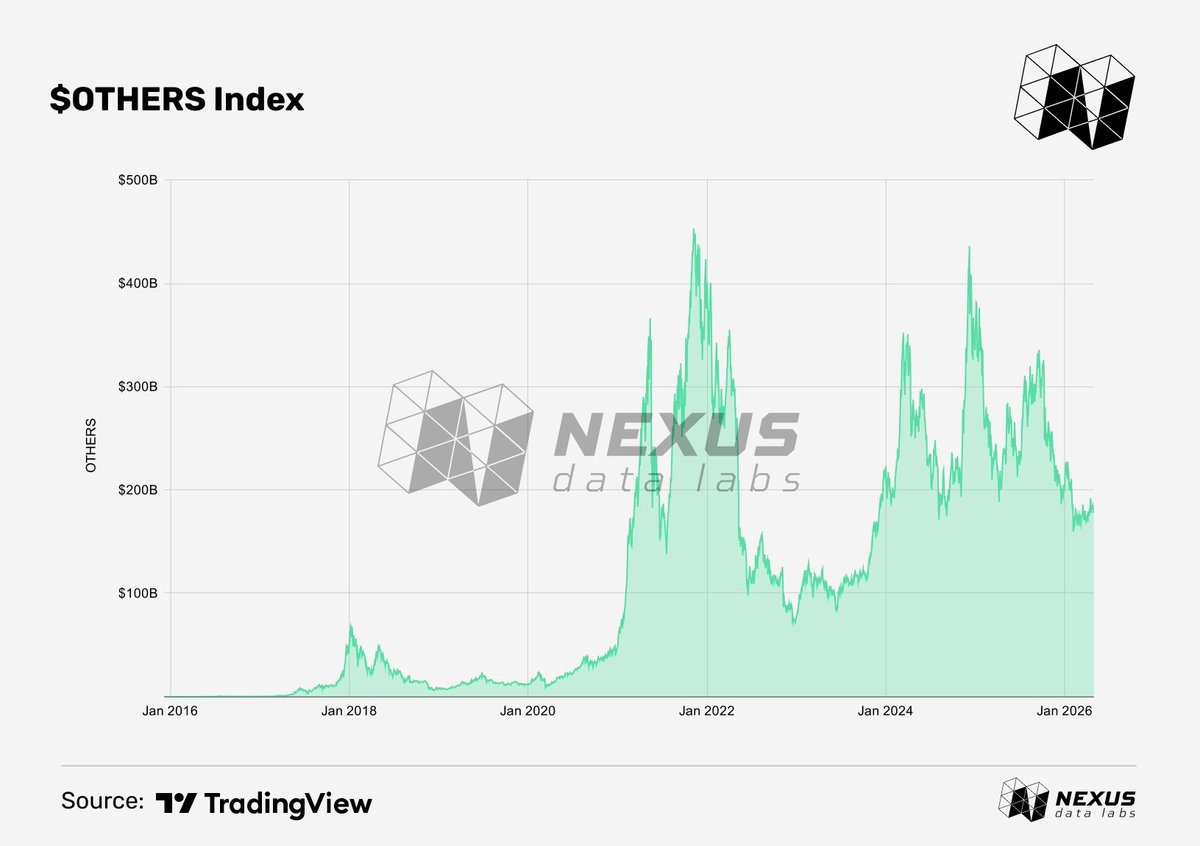
OTHERS tracks the combined market cap of the top 125 crypto assets outside the top 10. It covers the long tail of the market: small caps, mid caps, memecoins, alternative Layer 1s, AI tokens, and other smaller names that collectively move billions of dollars.
The math is straightforward: take the combined market cap of the top 125 crypto assets and subtract the top 10.
OTHERS = Top 125 Crypto Assets Market Cap − Top 10 Crypto Assets Market Cap
Unlike BTC Dominance, OTHERS is denominated in dollars, not as a percentage. It measures how much capital is allocated to the long tail at any given moment. Where BTC Dominance shows whether capital is concentrated in Bitcoin, OTHERS shows whether it is reaching the riskiest part of the market, the part that historically moves last and moves fastest.
2. Why Does the OTHERS Index Move?
OTHERS is driven by dynamics that play out differently from Bitcoin and the majors.
Risk appetite at its extreme. Small caps sit at the far end of the risk curve. OTHERS expands when speculation is running hot and traders start reaching further down the curve beyond the major cryptocurrencies in search of higher returns.
Narrative-driven rotations. The long tail is where new themes are born. AI tokens, memecoins, RWA tokens, DePIN. Each new narrative spawns dozens or hundreds of small projects. When a theme catches fire, capital flows into the OTHERS bucket faster than it does into Bitcoin or established large caps.
Liquidity conditions. Small caps need loose money to thrive. When there is plenty of money flowing through the market, capital reaches further down the risk curve and OTHERS expands. When money tightens and investors turn cautious, the long tail bleeds first. Traders sell their riskiest positions before anything else.
3. OTHERS Across Market Cycles
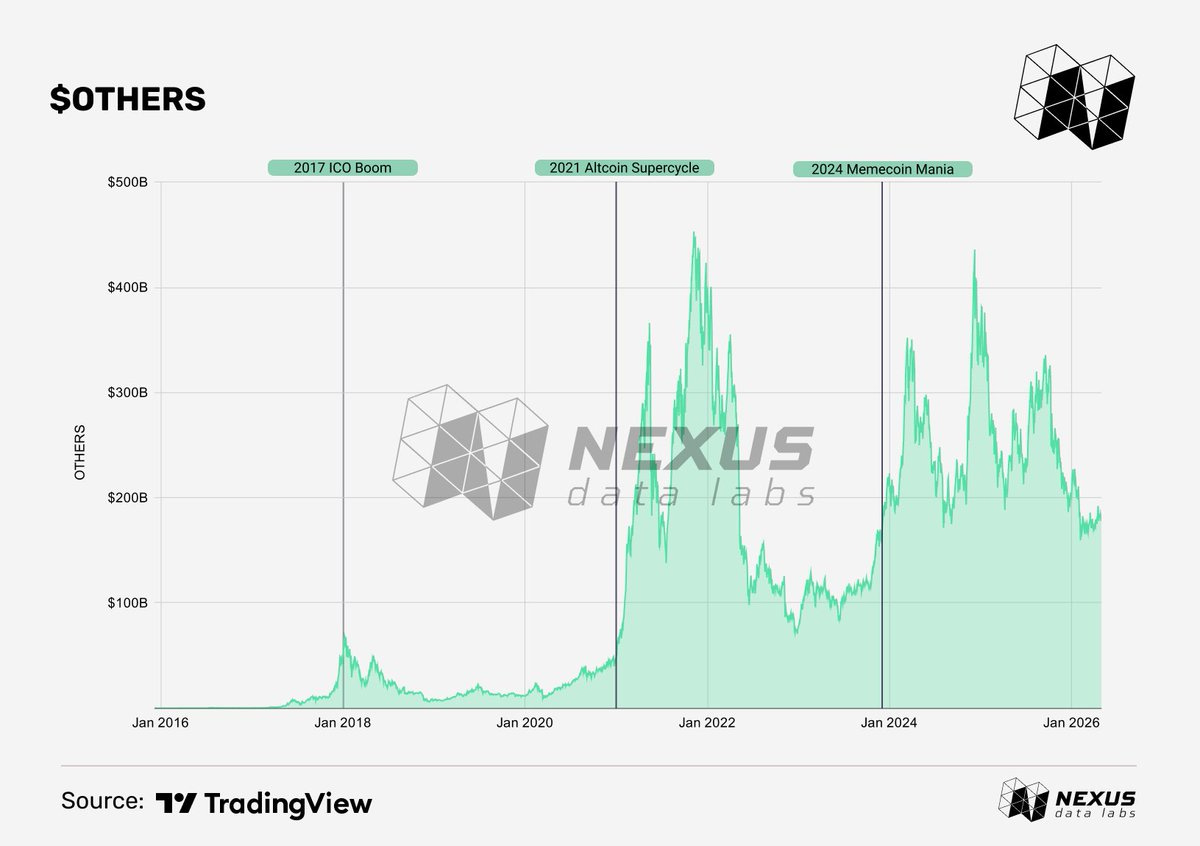
OTHERS has expanded during every major altcoin cycle, but the trigger has been different each time.
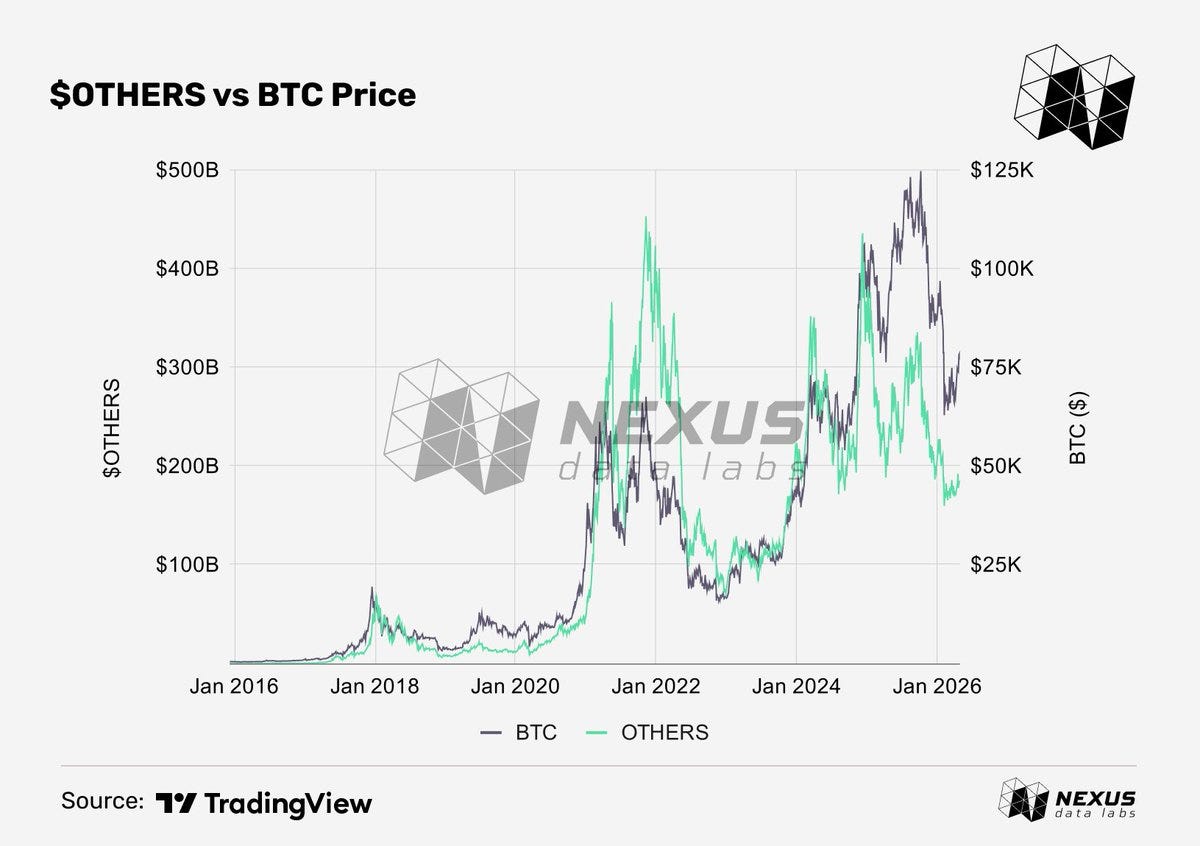
2017 ICO boom. OTHERS had its first real moment. The ICO wave produced thousands of new tokens, most sitting well outside the top 10. The index expanded from under $1 billion in early 2017 to roughly $68 billion at its January 2018 peak. When the bubble collapsed, it gave back nearly all of those gains.
2021 altcoin supercycle. OTHERS reached its all-time high in late 2021 as DeFi protocols, NFTs, and alternative Layer 1s pulled capital deep into the long tail. The index peaked at roughly $415 billion, more than five times its 2018 high. It was the broadest capital rotation the long tail had seen to that point.
2024 memecoin and AI rotation. In the earlier part of the cycle, memecoins on Solana and Base and AI tokens drove a sharp expansion in OTHERS even as Bitcoin set new highs on its own track. For the first time, the long tail moved primarily on narrative momentum rather than infrastructure buildouts.
2024 institutional era. As the cycle matured, the historical pattern broke. ETF inflows and corporate treasury purchases concentrated capital in Bitcoin, with secondary flows into Ethereum. The long tail did not benefit proportionally from the bull market. OTHERS lagged the majors, marking a structural shift in how capital enters crypto.
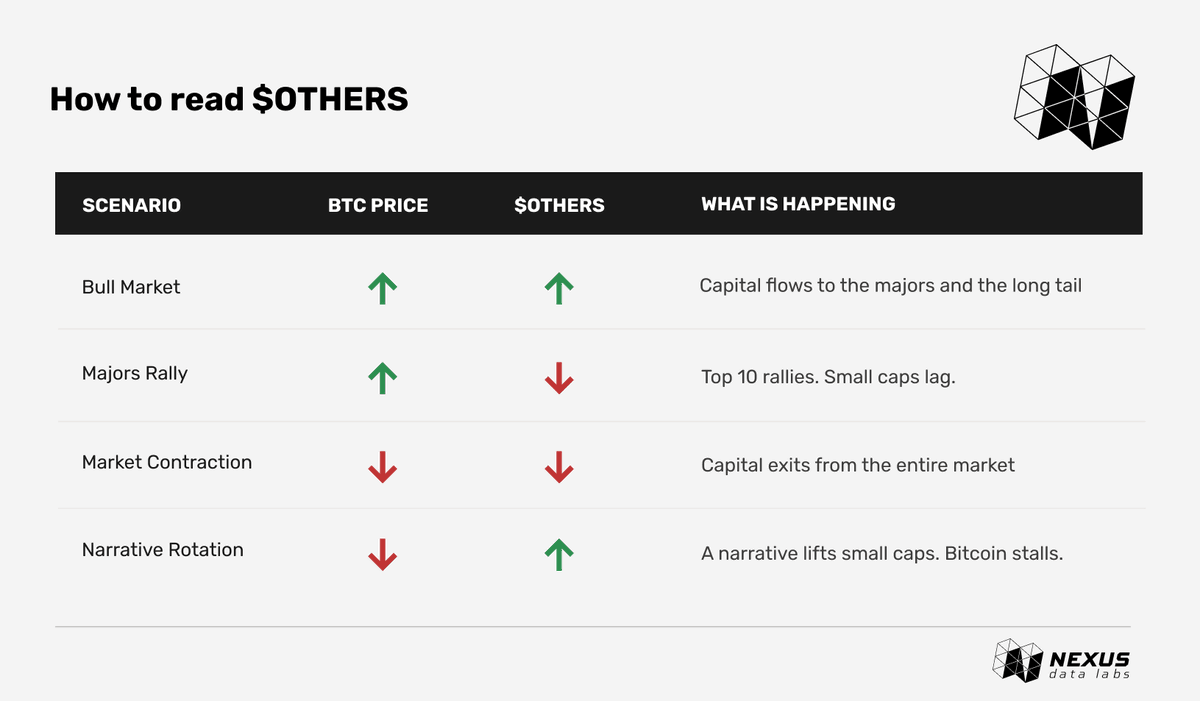
4. How to Read the OTHERS Index
OTHERS is often paired with Bitcoin's price to understand whether capital is flowing all the way down to the long tail or staying concentrated in the majors.
5. Trading the OTHERS Index
OTHERS gives traders a way to take a directional view on the small-cap segment of the market without assembling dozens of individual positions. The strategies below are setups commonly used to express views on altcoin indices. They are included here for educational purposes only. None of this is financial advice. Always do your own research before making any trading decisions.
Trend Setup: 50-Day and 200-Day Moving Average Cross
The 50-day and 200-day moving averages are used to define the broader trend for OTHERS. When the 50-day SMA crosses above the 200-day SMA on the weekly chart, historically known as a golden cross, it has marked the start of multi-quarter expansions in the long tail. The inverse cross has signaled prolonged contractions.
How traders approach it: go long OTHERS on a confirmed weekly close after the 50-day SMA crosses above the 200-day SMA on the weekly chart. Exit or short on the reverse cross.
Relative Strength: OTHERS / BTC Ratio
The OTHERS/BTC ratio strips out the overall direction of crypto and isolates one question: is the long tail gaining or losing ground against Bitcoin? When the ratio breaks out of a sustained base, capital is starting to favor small caps. When it breaks down, the long tail is losing ground relative to the safest crypto holding.
How traders approach it: watch the OTHERS/BTC ratio chart. When the ratio starts climbing after a long flat period, capital is rotating into small caps. Go long OTHERS. When the ratio starts dropping after a sustained uptrend, the long tail is losing ground relative to Bitcoin. Short OTHERS.
Cycle Positioning: Late Bull Long, Early Bear Short
OTHERS has never led a cycle. It lags. Bitcoin moves first, then capital flows into Ethereum and the rest of the top 10, and only after that does it reach the long tail. In bear markets, the reverse is also true. Small caps bleed first because investors exit their riskiest positions before anything else.
How traders approach it: go long OTHERS once BTC Dominance has rolled over from a peak and total crypto market cap is printing new highs. Reduce exposure or short OTHERS at the first signs of broader market weakness, as the long tail tends to sell off before the majors.
6. Trading the OTHERS Index Onchain
Until now, getting concentrated exposure to the small-cap segment of the crypto market meant assembling and rebalancing a basket of dozens of individual tokens. Gas fees, slippage on illiquid pairs, and projects rotating in and out of relevance added up quickly. The position traders ended up with rarely reflected the original thesis.
Paragon (@tradeparagon) addresses this directly. It lists an OTHERS perpetual contract on Hyperliquid, letting traders express a view on the entire long tail of the market through a single instrument without managing multiple positions.
Beyond OTHERS, Paragon also lists BTC.D, which measures Bitcoin’s share of the total crypto market, and TOTAL2, which tracks the altcoin market excluding Bitcoin. Together, the three indices cover the major segments of crypto market structure, whether that is hedging an altcoin portfolio, positioning for rotation between majors and small caps, or trading the long tail as a standalone market.
Learn more at Paragon.
Disclaimer
This article was produced in partnership with Paragon. The content is for informational and educational purposes only and does not constitute financial, investment, or trading advice. Nothing in this article should be relied on as a recommendation to buy, sell, or hold any digital asset. Do your own research before making any trading decisions.